HR Analytics Explained: How Data Is Reshaping HR in 2026
HR analytics is the practice of using employee and workforce data to make smarter HR decisions. This guide explains the four levels of HR analytics (descriptive, diagnostic, predictive, prescriptive), the metrics that matter most, the difference between HR analytics, people analytics, and workforce analytics, the top tools and platforms, and the new 2026 legal guardrails (EU AI Act, Pay Transparency Directive, GDPR) every HR team needs to know.

HR analytics (also called people analytics or workforce analytics) is the practice of collecting, measuring, and interpreting employee and workforce data to make better HR decisions. It transforms gut-feel HR into evidence-based HR by combining data from HRIS systems, payroll, performance reviews, engagement surveys, recruitment platforms, and learning systems to answer questions about hiring, retention, performance, engagement, and workforce planning.
In 2026, HR analytics has moved from a fringe specialism inside large enterprises to a mainstream HR competency. The shift is driven by three forces: AI and machine learning making predictive models accessible without a data science team, rising hiring costs and skills shortages forcing CFOs to demand workforce ROI, and the arrival of pay transparency and pay equity laws (EU Pay Transparency Directive enters full force June 2026) that make accurate, auditable workforce data a legal requirement rather than a nice-to-have.
This glossary entry covers what HR analytics is, the four levels of HR analytics (descriptive, diagnostic, predictive, prescriptive) and what each one answers, the most important HR metrics to track, real-world examples of how leading companies use HR analytics, the difference between HR analytics and people analytics and workforce analytics, the typical tools and tech stack, and the most common pitfalls HR teams encounter when building an analytics function.
What Is HR Analytics?
HR analytics is the systematic application of data analysis to people and workforce questions. It uses quantitative methods to turn raw HR data into insights that inform hiring, retention, development, performance, and workforce planning decisions.
In practical terms, HR analytics answers four core questions:
- What happened? (descriptive analytics)
- Why did it happen? (diagnostic analytics)
- What is likely to happen next? (predictive analytics)
- What should we do about it? (prescriptive analytics)
A simple example: an HR team notices that 18% of engineers left in the past year (descriptive). Diagnostic analytics shows that the highest attrition came from the team with the largest manager span of control (15+ direct reports per manager). Predictive analytics flags that 12 more engineers in similar team structures are at high risk of leaving in the next 6 months. Prescriptive analytics recommends restructuring into smaller teams with intermediate managers and offering targeted retention bonuses to the 12 flagged employees. Each level of analytics builds on the one before, moving HR from reactive reporting to proactive intervention.
HR analytics is not the same as HR reporting. HR reporting tells you headcount, vacancy rates, training completions, and turnover numbers, all useful descriptive snapshots, but ultimately backward-looking. HR analytics goes further by looking for patterns, causes, predictions, and recommended actions that reporting alone cannot deliver.
The Four Levels of HR Analytics
Most modern HR analytics frameworks recognise four progressive levels, each more sophisticated than the last. Organisations typically start with descriptive analytics and gradually mature toward prescriptive over several years.
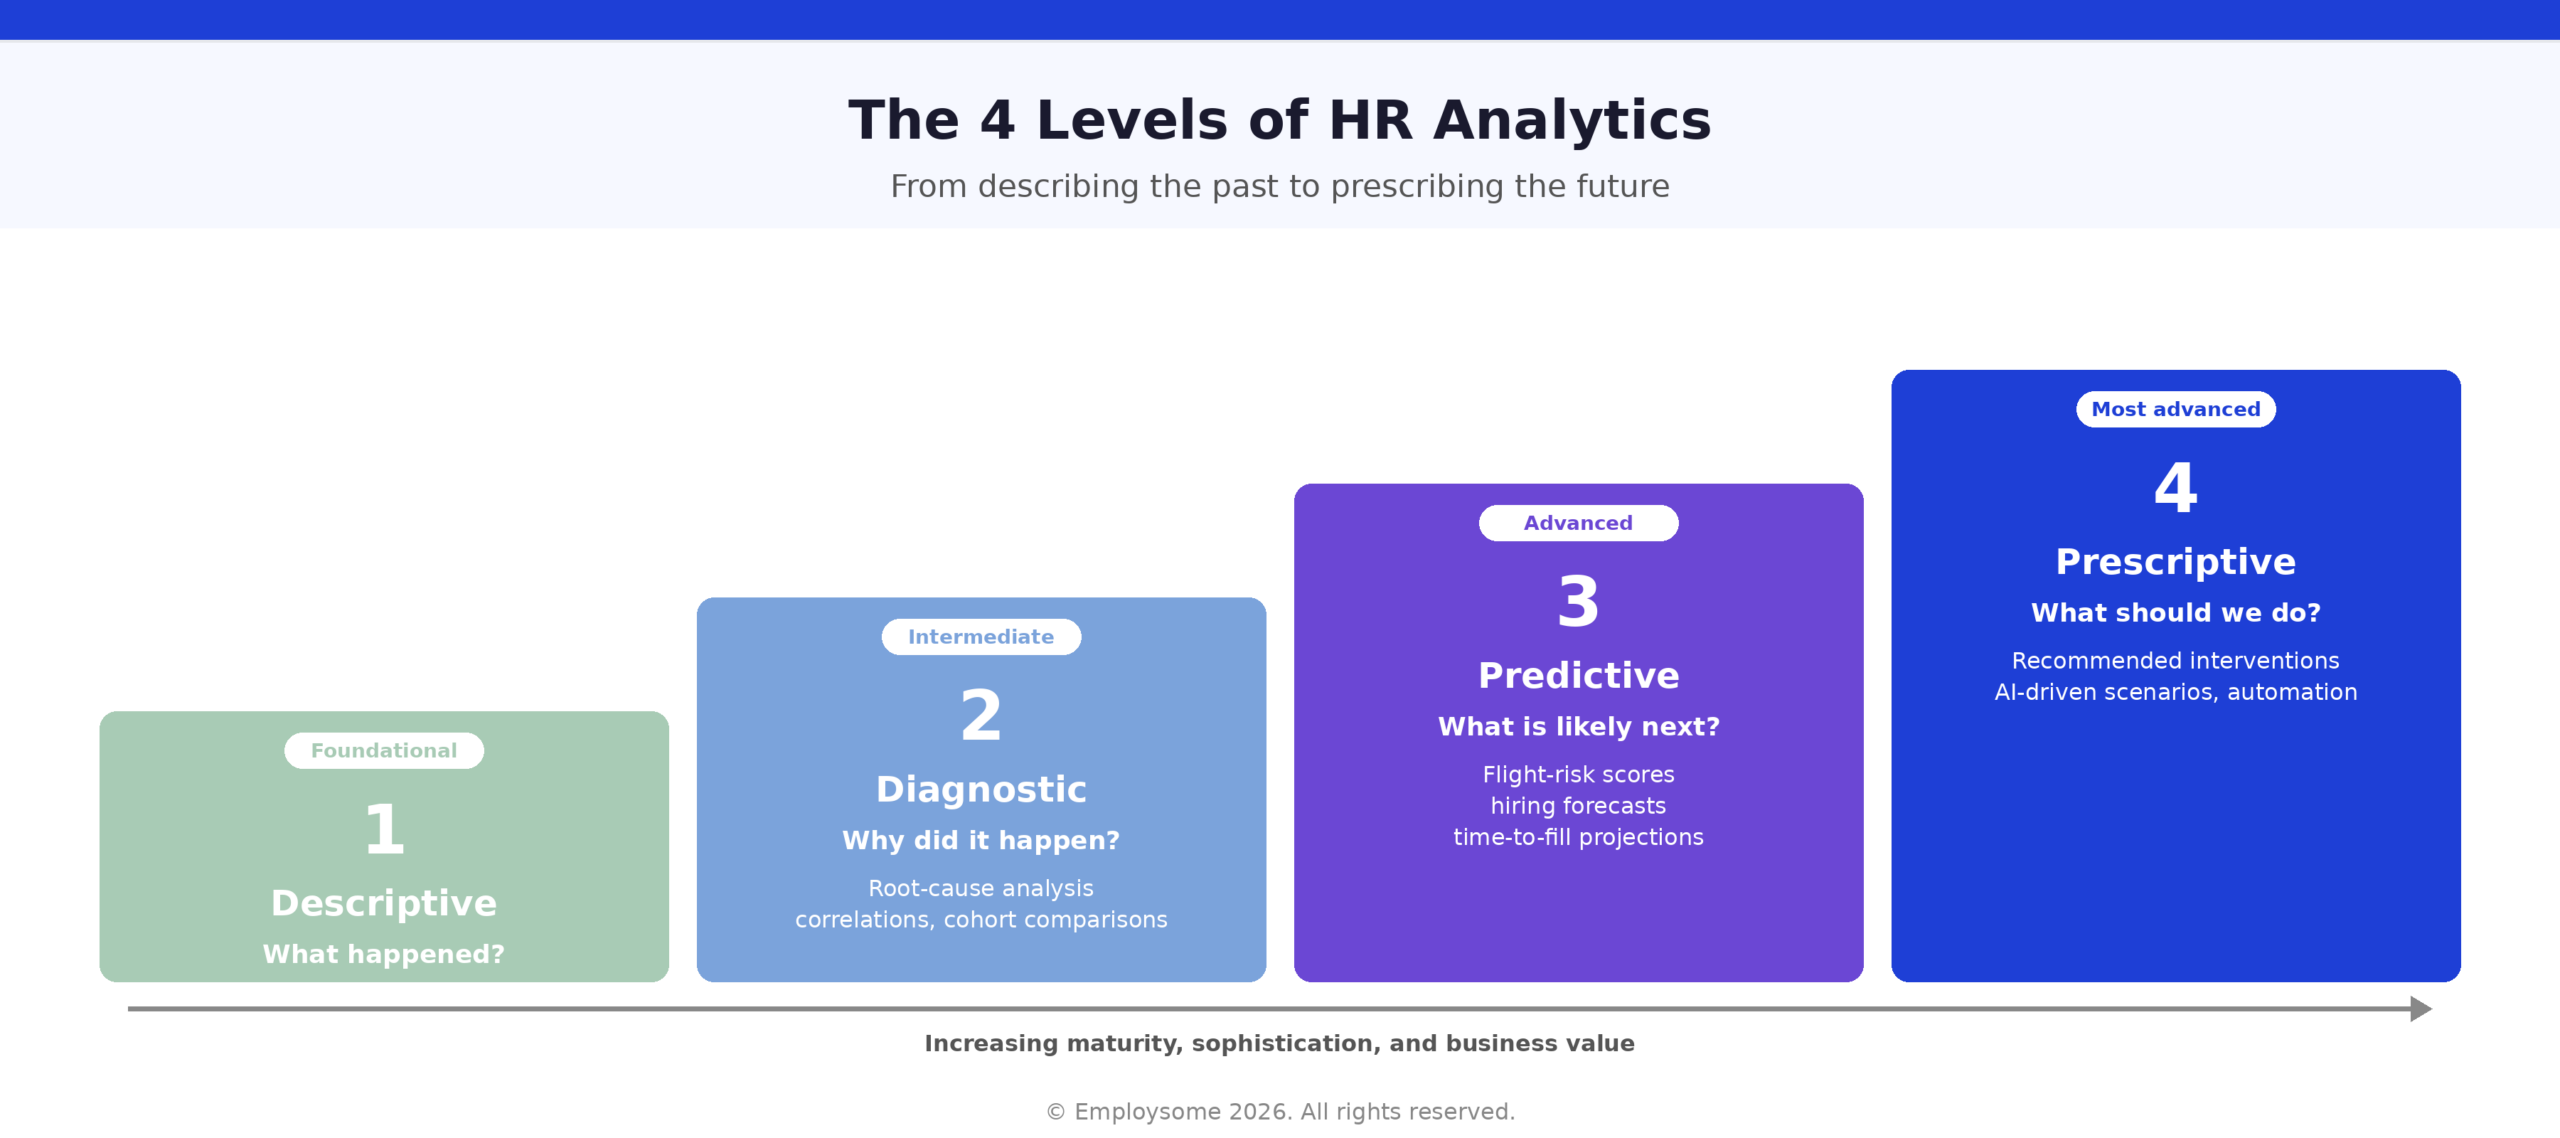
| Level | Question Answered | Common Outputs | Maturity |
| 1. Descriptive | What happened? | Dashboards, KPI reports, headcount summaries, turnover rates, time-to-hire averages | Foundational |
| 2. Diagnostic | Why did it happen? | Root-cause analysis, correlations, cohort comparisons, segmentation studies | Intermediate |
| 3. Predictive | What is likely to happen? | Flight-risk scores, hiring demand forecasts, performance forecasts, time-to-fill projections | Advanced |
| 4. Prescriptive | What should we do about it? | Recommended interventions, automated workflows, scenario modelling, AI-driven suggestions | Most advanced |
Descriptive analytics is the foundation of every HR analytics function. It uses historical data to summarise what has happened: turnover rates last quarter, average time-to-hire by department, training completion rates, absenteeism trends. Descriptive analytics is essential for compliance reporting and establishing baselines but does not explain causes or predict outcomes.
Diagnostic analytics answers why something happened. It correlates different data points to find root causes. For example, descriptive analytics might show 25% engineering turnover; diagnostic analytics digs into the data to find that turnover is concentrated in employees who joined in the last 18 months and who reported low scores on the manager support question in the engagement survey.
Predictive analytics uses statistical models and machine learning to forecast future outcomes. Common predictive HR outputs include flight-risk scores (the probability an employee will leave within 6 or 12 months), hiring demand forecasts, time-to-fill projections, and performance trajectory predictions. Predictive analytics typically requires at least two years of clean historical data and a statistical or machine learning model.
Prescriptive analytics goes one step further by recommending specific actions. Instead of just predicting that an employee is likely to leave, prescriptive analytics recommends what to do about it: a targeted retention conversation, a learning programme, an internal mobility opportunity, or a compensation adjustment. Prescriptive analytics is where AI and large language models are creating the biggest gains in 2026, with platforms now able to generate personalised intervention recommendations at scale.
💡 Employsome Insight: Clean Data Matters More Than Fancy Tools
Most HR analytics initiatives fail not because the tools are inadequate but because the underlying data is messy. Multiple HR systems with inconsistent employee IDs, missing or unstructured data fields, and siloed engagement and performance data make it almost impossible to do meaningful analysis. Before investing in advanced analytics tooling, invest in data hygiene: a single source of truth for employee records, consistent taxonomies for job titles and roles, structured engagement data, and clean integrations between your HRIS, payroll, performance, and learning systems. Without clean data, predictive models produce predictions that look credible but are quietly wrong.
The Most Important HR Metrics to Track
HR analytics is built on metrics. The choice of metrics depends on the business question being asked, but most analytics functions track a core set of HR KPIs organised by category. Below are the most commonly tracked metrics in 2026, grouped by the HR area they describe.
Recruitment and talent acquisition metrics:
- Time-to-hire: Days from job opening to accepted offer
- Time-to-fill: Days from job requisition approval to offer accepted
- Cost-per-hire: Total recruiting spend divided by number of hires
- Quality-of-hire: Performance ratings of new hires at 6 or 12 months
- Source-of-hire effectiveness: Hire conversion rate by sourcing channel
- Offer acceptance rate: Percentage of offers accepted by candidates
Retention and turnover metrics:
- Voluntary turnover rate: Percentage of employees who chose to leave in a period
- Involuntary turnover rate: Percentage of employees who were dismissed or made redundant
- Regrettable turnover: Voluntary departures of high-performers or high-potentials
- First-year attrition: Percentage of new hires who leave within 12 months
- Average tenure: Average length of service across the organisation
- Flight-risk score: Probability an employee will leave in a defined window (predictive metric)
Engagement and experience metrics:
- eNPS (Employee Net Promoter Score): Likelihood employees would recommend the company as a place to work
- Engagement survey scores: Aggregate or driver-level scores from pulse and annual surveys
- Manager effectiveness score: Engagement scores filtered by manager
- Absenteeism rate: Days lost to unscheduled absence
- Survey response rate: Participation rate in engagement surveys
Performance and development metrics:
- Performance distribution: Spread of performance ratings across the organisation
- Promotion rate: Percentage of employees promoted within a period
- Internal mobility rate: Percentage of roles filled internally
- Learning hours per employee: Average training hours per employee per year
- Skills coverage: Percentage of critical skills covered across the workforce
Diversity, equity, and pay metrics:
- Representation by level: Demographic breakdown by job level and function
- Hiring funnel diversity: Demographic conversion rates through the recruitment process
- Pay equity ratio: Adjusted and unadjusted pay gap by demographic group
- Promotion rate parity: Promotion rates across demographic groups
- Inclusion index: Survey-derived measure of employee inclusion
Workforce planning and productivity metrics:
- Headcount: Total employees by function, location, level
- Span of control: Average direct reports per manager
- Vacancy rate: Open roles as percentage of total positions
- Revenue per employee: Total revenue divided by FTE headcount
- Workforce cost ratio: Total people cost as percentage of revenue or opex
No single HR analytics function tracks all of these. The best approach is to start with 8 to 12 metrics that map directly to the top business priorities (typically retention, hiring quality, and engagement), establish reliable measurement, and then expand the metric set as the analytics function matures.
HR Analytics vs People Analytics vs Workforce Analytics
HR analytics, people analytics, and workforce analytics are often used interchangeably in everyday HR conversation, but the terms have meaningful differences in scope and emphasis.
| Term | Primary Focus | Typical Owner |
| HR analytics | Operational HR efficiency: hiring, retention, performance, training, compliance reporting | HR operations and HRIS teams |
| People analytics | Strategic people insights: engagement drivers, high-potential identification, leadership effectiveness, organisational design | Dedicated people analytics teams reporting to CHRO |
| Workforce analytics | Workforce planning and supply: headcount forecasting, scenario modelling, capacity planning, location strategy | Finance and FP&A in partnership with HR |
| Talent analytics | Hiring funnel, sourcing, candidate experience, recruiter productivity | Talent acquisition leadership |
In practice, the distinctions blur and the terms overlap. A well-developed analytics function uses all four lenses on the same underlying employee data, surfacing different insights for different stakeholders. The vocabulary tends to follow organisational maturity: smaller and earlier-stage HR teams talk about HR analytics; larger and more mature organisations build dedicated people analytics functions.
HR Analytics in Practice: Real-World Use Cases
The fastest way to understand HR analytics is to see it applied. Below are representative use cases that map to each level of analytics maturity.
Predicting voluntary turnover. Models trained on historical employee data (tenure, role, manager, performance trends, compensation percentile, learning activity, manager changes) generate flight-risk scores for each employee. Used proactively, this allows HR to engage with at-risk employees before they resign rather than reacting after notice is given. Experian uses machine learning to predict high-flight-risk employees and then tracks which interventions (manager change, role expansion, learning) actually reduce attrition.
Reducing time-to-hire. Analytics on the recruitment funnel reveals where candidates drop off: long screening calls, slow interviewer feedback, multiple rounds of executive approval. Cohort analysis by recruiter, channel, and role surfaces patterns. Prescriptive analytics then recommends specific changes such as collapsing interview rounds for senior engineering roles or shifting sourcing budget from underperforming channels.
Improving manager effectiveness. Engagement survey scores segmented by manager reveal which managers consistently produce high engagement and which do not. Diagnostic analytics correlates manager scores with team turnover, performance ratings, and internal promotion rates, identifying which behaviours separate top managers from poor ones. Prescriptive analytics recommends targeted manager development for individuals with low scores in specific areas.
Closing the pay equity gap. With pay transparency legislation accelerating in 2026 (EU Pay Transparency Directive enters full force in June 2026, requiring employers with 100+ workers to report pay gaps), pay equity analytics has moved from optional to mandatory. Analytics identifies adjusted pay gaps (controlling for role, level, tenure, performance) versus unadjusted gaps, flags specific roles or levels with statistically significant disparities, and recommends targeted compensation adjustments.
Workforce planning and scenario modelling. Predictive workforce models forecast headcount needs based on growth scenarios, attrition assumptions, internal mobility, and external hiring market conditions. Scenario modelling lets CFOs and CHROs answer questions like “if we grow revenue 30% next year, how many engineers do we need to hire, and where?”
Improving training ROI. Analytics correlates training completion data with subsequent performance ratings, internal promotions, and retention. Programmes that fail to move any of these metrics are candidates for redesign or cancellation; programmes with strong correlation get expanded.
Optimising internal mobility. Analytics identifies employees with skills, performance, and tenure profiles that match open roles inside the company. Prescriptive systems then surface those matches to managers and employees, reducing external hiring costs and improving retention.
HR Analytics Tools and Tech Stack
The HR analytics tech stack typically combines three layers: a data layer (where employee data lives), an analytics layer (where calculations and models run), and a presentation layer (where users see insights).
| Layer | Purpose | Common Tools |
| Data layer (HRIS / HCM) | System of record for all employee data | Workday, SAP SuccessFactors, Oracle HCM, BambooHR, HiBob, Personio, Rippling |
| Engagement and survey | Pulse surveys, engagement, eNPS | Culture Amp, Lattice, Glint, Peakon, Officevibe, 15Five |
| Performance and learning | Reviews, goals, learning data | Lattice, 15Five, Reflektive, Cornerstone, Workday Learning |
| Analytics and BI | Dashboards, ad hoc analysis, modelling | Tableau, Power BI, Looker, ChartHop, Visier, Crunchr, OneModel |
| Specialist people analytics | Out-of-the-box HR analytics models | Visier, ChartHop, Crunchr, OneModel, eqtble, Orgnostic |
| Data warehouse / lake | Centralised analytics-ready data | Snowflake, BigQuery, Databricks, Redshift |
| Programming and statistics | Custom modelling and prediction | Python (pandas, scikit-learn), R, SQL |
Smaller HR teams often start with their HRIS’s built-in dashboards and a BI tool like Power BI or Tableau. Mid-sized organisations add a specialist people analytics platform like Visier, ChartHop, or Crunchr. Large enterprises build dedicated people analytics teams with data warehouses, custom models in Python or R, and integration across HRIS, finance, and operational systems.
2026 AI capabilities are reshaping the stack. Most major HRIS and people analytics platforms now embed AI features for natural-language querying (“which teams have the highest flight risk?”), automated insight generation, and personalised intervention recommendations. The skill demand has shifted from building models to interpreting AI-generated insights and ensuring data governance.
Legal and Ethical Guardrails for HR Analytics in 2026
HR analytics is also one of the most legally sensitive areas of HR. Predictive models that influence hiring, promotion, or termination decisions can trigger discrimination claims if not properly designed and governed. The legal and ethical guardrails around HR analytics in 2026 are tightening rapidly.
Key regulatory developments to know:
- EU AI Act: Classifies AI systems used in employment (recruitment, promotion, firing, performance evaluation) as high-risk, requiring conformity assessments, technical documentation, human oversight, and bias testing. High-risk AI obligations apply from August 2026.
- EU Pay Transparency Directive: Full enforcement from 7 June 2026. Employers with 100+ workers must report gender pay gaps, with specific remediation obligations if the gap exceeds 5%. Analytics-grade pay equity audits are effectively mandatory.
- EU GDPR: Restricts profiling and automated decisions that significantly affect employees. Employees have the right to human review and explanations of model-driven decisions.
- NYC Local Law 144 (US): Requires bias audits of automated employment decision tools used in hiring or promotion in New York City.
- Colorado AI Act, California AB 2930, Illinois AIVID Act: State-level US legislation imposing transparency, bias-testing, and notification requirements on AI in employment.
Ethical design principles: Avoid using protected attributes (race, gender, age, disability, sexual orientation) directly in predictive models. Test for disparate impact using subgroup metrics. Maintain human review of any model-driven decisions affecting employment status. Document model design, data inputs, and validation results to enable audits. Be transparent with employees about what data is collected and how it is used.
What HR Leaders Need to Know
HR analytics is the use of data to improve HR decisions
It transforms HR from gut-feel reporting to evidence-based practice by combining data from HRIS, payroll, engagement, performance, and learning systems to answer specific business questions about hiring, retention, performance, and workforce planning.
The four levels of HR analytics build on each other
Descriptive (what happened), diagnostic (why it happened), predictive (what is likely to happen), and prescriptive (what to do about it). Most HR teams operate at descriptive and diagnostic levels; building toward predictive and prescriptive is the maturity journey for the next 5 years.
Clean data matters more than fancy tools
Most HR analytics initiatives fail because of inconsistent employee IDs, siloed systems, and unstructured engagement data. Invest in data hygiene before investing in advanced analytics tooling. Without clean data, predictive models produce predictions that look credible but are quietly wrong.
Start with 8 to 12 metrics tied to business priorities
Most analytics functions track too many metrics and act on too few. Focus on the 8 to 12 KPIs that map directly to the top business questions (typically retention, hiring quality, engagement, and pay equity). Establish reliable measurement and ruthlessly drop metrics that nobody acts on.
HR analytics, people analytics, and workforce analytics overlap
In practice the terms are used interchangeably. HR analytics emphasises operational HR; people analytics emphasises strategic insights; workforce analytics emphasises planning and supply. A mature analytics function uses all three lenses on the same underlying data.
Predictive and prescriptive models are now legally regulated
The EU AI Act, NYC Local Law 144, and a wave of US state laws now impose bias-testing, documentation, and human-oversight requirements on AI tools used in employment decisions. Treat AI-driven HR analytics as a compliance domain, not just a productivity domain.
Pay transparency is making analytics non-optional
The EU Pay Transparency Directive (full force June 2026) requires employers with 100+ workers to report gender pay gaps and remediate gaps above 5%. Analytics-grade pay equity audits are now a legal obligation in much of Europe, with similar movements in US states. HR teams without analytics capability will struggle to comply.
The skill is interpreting insights, not building models
In 2026, AI handles most of the modelling work. The premium HR analytics skill is no longer building a regression model in R but understanding which questions matter to the business, judging the credibility of model outputs, and translating insights into management actions.

Frequently Asked Questions
HR analytics is the practice of collecting, measuring, and interpreting employee and workforce data to make better HR decisions. It combines data from HRIS, payroll, performance reviews, engagement surveys, recruitment platforms, and learning systems to answer questions about hiring, retention, performance, engagement, and workforce planning. It is also called people analytics or workforce analytics, with subtle differences in scope and emphasis.
The four types of HR analytics are descriptive (what happened, e.g., last quarter’s turnover rate), diagnostic (why it happened, e.g., correlation between manager span of control and turnover), predictive (what is likely to happen, e.g., flight-risk scores for individual employees), and prescriptive (what to do about it, e.g., recommended retention interventions for at-risk employees). Each level builds on the previous one, moving HR from reactive reporting to proactive intervention.
In practice the two terms overlap and are often used interchangeably. HR analytics typically emphasises operational HR efficiency: hiring metrics, turnover, training, compliance reporting. People analytics typically emphasises strategic insights: engagement drivers, leadership effectiveness, organisational design, high-potential identification. People analytics is often associated with dedicated analytics functions reporting to a CHRO, whereas HR analytics is associated with HR operations teams. The vocabulary tends to follow organisational maturity rather than describing fundamentally different practices.
Start with 8 to 12 metrics that map to top business priorities. Core metrics for most organisations include: voluntary turnover rate, regrettable turnover, time-to-hire, cost-per-hire, quality-of-hire, eNPS or engagement score, manager effectiveness score, internal mobility rate, performance distribution, headcount and span of control, and adjusted and unadjusted pay equity ratios. Avoid tracking too many metrics: most HR analytics functions fail by drowning in data rather than producing actionable insights from a focused set.
The HR analytics tech stack typically combines an HRIS (Workday, SAP SuccessFactors, BambooHR, HiBob, Personio), an engagement platform (Culture Amp, Lattice, Peakon), a BI tool (Tableau, Power BI, Looker), and increasingly a specialist people analytics platform (Visier, ChartHop, Crunchr, OneModel). Larger enterprises also use data warehouses (Snowflake, BigQuery, Databricks) and custom modelling in Python or R. In 2026, most platforms now embed AI features for natural-language querying and automated insight generation.
Yes, but with significant constraints. Under GDPR, profiling and automated decisions that significantly affect employees require a lawful basis, transparency to the employee, and the right to human review. Under the EU AI Act (high-risk obligations from August 2026), AI systems used in recruitment, promotion, performance evaluation, or termination are classified as high-risk and require conformity assessments, bias testing, technical documentation, and human oversight. HR analytics functions using AI must build compliance into their design from the start.
Predictive HR analytics uses historical HR data and statistical or machine learning models to forecast future workforce outcomes. Common predictions include flight-risk scores (probability of an employee leaving within 6 or 12 months), hiring demand forecasts, time-to-fill projections for open roles, and performance trajectory predictions. Predictive models typically need at least two years of clean historical data and must be tested for bias, particularly when their outputs influence employment decisions.
HR reporting tells you headcount, vacancy rates, training completions, and turnover numbers as descriptive snapshots, but it is fundamentally backward-looking. HR analytics goes further by looking for patterns, causes, predictions, and recommended actions. Reporting answers “what is the turnover rate?” Analytics answers “why is the engineering turnover rate twice the company average, which employees are most at risk of leaving next, and what should we do about it?”
Start with three steps: (1) clean your data by establishing a single source of truth for employee records and consistent integrations across HRIS, payroll, engagement, and performance systems; (2) define 8 to 12 priority metrics that map to your top business questions (typically retention, hiring quality, engagement, pay equity); (3) build basic descriptive dashboards before investing in advanced predictive tooling. Most HR analytics initiatives fail not because of tooling but because of messy underlying data, so data hygiene is the highest-leverage first investment.
No. HR analytics informs and supports judgement; it does not replace it. The role of analytics is to surface patterns, predictions, and options that HR leaders might otherwise miss. The decisions about hiring, promotion, compensation, and termination still require human judgement, ethical consideration, and accountability. The 2026 EU AI Act explicitly requires human oversight of AI-driven employment decisions, and most pay equity audits require manager review of flagged compensation gaps before adjustments are made. Analytics is a powerful input to HR decision-making, not a substitute for it.
Courtney Pocock is a Copywriter at Employsome with 15+ years of experience writing for the HR, corporate, and financial sectors. She has a strong interest in global business expansion and Employer of Record / PEO topics, focusing on news that matters to business owners and decision-makers. Courtney covers industry updates, regulatory changes, and practical guides to help leaders navigate international hiring with confidence. Connect with Courtney on LinkedIn.
Our content is created for informational purposes only and is not intended to provide any legal, tax, accounting, or financial advice. Please obtain separate advice from industry-specific professionals who may better understand your business’s needs. Read our Editorial Guidelines for further information on how our content is created.
Other posts
Review other blog posts