Recruiting Plan Template 2026: Build Your Hiring Roadmap
A recruiting plan template is a structured framework that helps HR and talent acquisition teams translate business goals into hiring priorities. This 2026 guide provides a complete template with 10 required sections, a worked example, key metrics to track, and common planning mistakes to avoid. Learn how to link headcount to revenue, budget total first-year cost, and integrate international hires via EOR.


A recruiting plan template is a structured framework that helps HR and talent acquisition teams translate business goals into hiring priorities. It defines which roles to fill, when, why, and how, while aligning headcount, budget, timeline, and sourcing channels in one document. A well-built template turns reactive hiring (posting jobs as vacancies appear) into proactive workforce planning tied to revenue, product roadmaps, and service-level targets.
The cost of not having a plan is high. Recent labour market research indicates that according to recent labour market research, 60-80% of employers in developed markets report difficulty filling roles with the right skills, and the cost of a bad hire is estimated at 30-40% of the new employee’s annual salary when hiring, onboarding, and early turnover costs are included. For a company hiring 20 people a year at an average salary of USD 70,000, a single bad-hire rate of 10% translates to annual losses of roughly USD 42,000 to USD 56,000 – material to any growing business.
This 2026 guide provides a complete recruiting plan template with all required sections, a worked example for a 12-month hiring plan, key metrics to track, common planning mistakes to avoid, and when a recruiting plan should integrate with an Employer of Record (EOR) or international hiring partner. You can use the framework below whether you are planning 5 hires or 500.
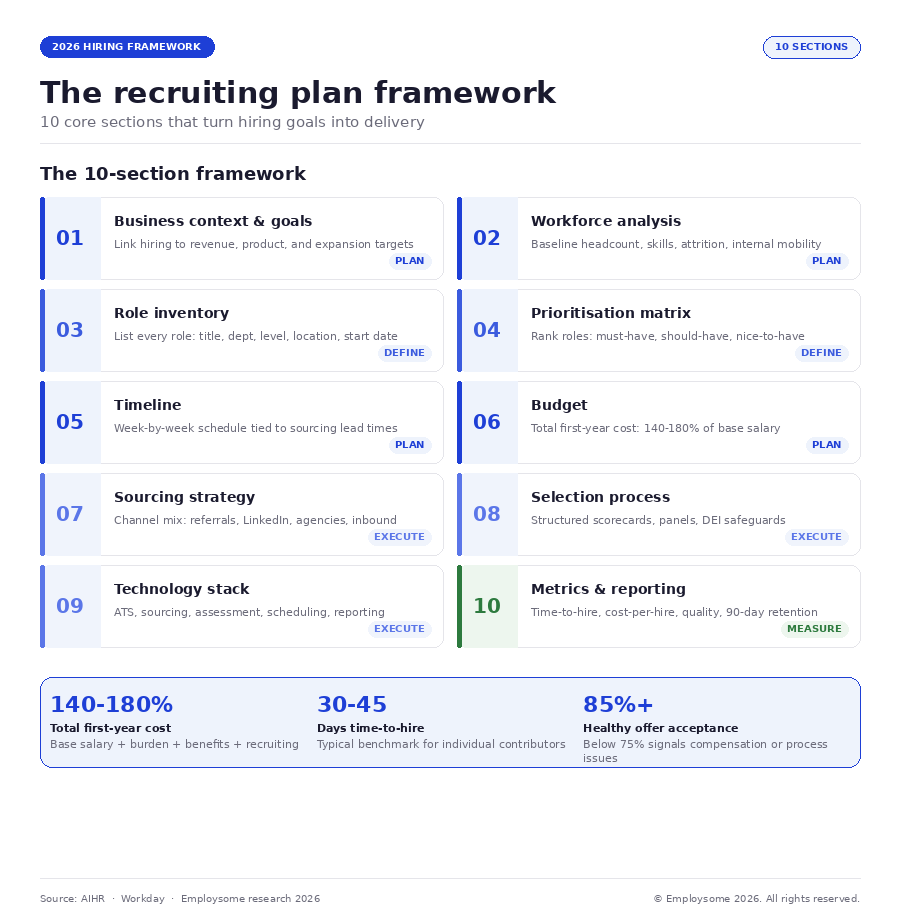
What a Recruiting Plan Template Includes: 10 Core Sections
A comprehensive recruiting plan template includes ten core sections. Smaller companies can simplify some sections, but the structure should remain recognisable so plans are comparable across quarters, teams, and budget cycles.
| Section | Purpose | Typical Inputs |
| 1. Business context & goals | Link hiring to company strategy | Revenue targets, product launches, market entries, retention data |
| 2. Workforce analysis | Baseline current headcount and skills | Org chart, skill inventory, attrition rate, internal mobility options |
| 3. Role inventory | List every role to be filled | Job title, department, reporting line, headcount, new vs replacement |
| 4. Prioritisation matrix | Rank roles by urgency and business impact | Must-have, should-have, nice-to-have tiers with business justification |
| 5. Timeline | Define when each role needs to be filled | Start date, sourcing lead time, expected interview cycle, onboarding window |
| 6. Budget | Estimate total cost of hiring | Salary bands, employer burden %, agency/ATS fees, relocation, signing bonus |
| 7. Sourcing strategy | How you will find candidates for each role | Inbound (careers page, job boards), outbound (LinkedIn, referrals, agencies), internal mobility |
| 8. Selection process | Define evaluation method per role type | Screening, skills tests, interview panel, scorecards, DEI safeguards |
| 9. Technology stack | Tools used at each stage | ATS, sourcing tools, assessment platforms, scheduling, reporting |
| 10. Metrics & reporting | Track delivery and iterate | Time-to-hire, cost-per-hire, offer acceptance rate, quality-of-hire, 90-day retention |
The sections are sequential: each builds on the previous one. Business context drives role inventory, role inventory drives prioritisation, prioritisation drives timeline, timeline drives budget, and so on. Skipping a step usually creates downstream problems – for example, a sourcing strategy built without a real budget leads to unrealistic agency expectations, and metrics without clear role definitions become meaningless.
Business Context, Goals, and Workforce Analysis
The first section of your recruiting plan should state clearly what the business is trying to achieve and how hiring supports those goals. This is what distinguishes a recruiting plan from a job requisition list – the plan answers the question “why these roles, why now, and what happens if we do not hire.”
Typical business-goal inputs include:
- Revenue targets: Expected ARR, new-business growth, or expansion in existing accounts that requires additional capacity
- Product roadmap: Engineering or design hires needed to ship specific features or launches
- Geographic expansion: New market entry requiring local sales, support, or compliance hires (see our international hiring guide)
- Regulatory or compliance changes: New roles required to meet legal obligations (DPO, compliance officer, safety manager)
- Retention and replacement needs: Backfills for planned departures, parental leave cover, redundancy redeployment
- Capacity or backlog indicators: Support ticket volume, sales pipeline velocity, or operations throughput signalling need for new heads
Write each goal with a specific, measurable outcome and a date. For example: “Launch in Germany by end of Q2 2026, requiring 1 Country Manager (hire by month 1), 2 Account Executives (hire by month 3), and 1 Solutions Engineer (hire by month 4).” Vague goals like “grow the team” produce vague plans.
Workforce analysis should baseline your current state before planning new hires. Document current headcount by department, current skill gaps (hard skills and leadership capacity), rolling 12-month attrition rate, and any internal mobility candidates who could move into open roles. Internal mobility is often undervalued – according to recent workforce data, hiring internally reduces time-to-productivity by 30-50% and improves retention significantly compared to external hires, according to AIHR’s 2026 hiring plan research.
💡 Employsome Insight: Most Recruiting Plans Fail in Section 1, Not Section 7
Most recruiting plans fail in section 1, not section 7. Teams jump to sourcing strategy and job descriptions before agreeing on what the business actually needs. When revenue slips or a launch is delayed, hiring commitments made without clear business context become impossible to defend. Start the plan with goals that each business stakeholder explicitly signs off on. If your CEO cannot summarise the rationale for each hire in one sentence, the plan is not ready.
Role Inventory and Prioritisation Matrix
Once goals are clear, list every role you plan to open in the plan period. For each role, capture structured data that flows into downstream sections (budget, timeline, sourcing).
| Field | Example |
| Job title | Senior Backend Engineer |
| Department | Engineering — Platform |
| Reporting line | VP Engineering |
| Type | New position |
| Headcount | 2 |
| Location | Remote EU / UK preferred |
| Employment type | Full-time permanent |
| Seniority level | Senior (6-10 years) |
| Business justification | Support Q2 2026 API v3 launch and existing backlog |
| Priority | Must-have |
| Target start date | 1 June 2026 |
| Budget range | €85,000-110,000 base + equity |
Prioritisation matrix: With the role inventory complete, rank each role into one of three tiers:
- Must-have (tier 1): Business commitments break if this role is not filled by the target date. Examples: revenue-generating sales hires tied to forecast, engineers for a committed product launch, regulated compliance roles.
- Should-have (tier 2): Important for operational efficiency but deferrable if budget or market conditions shift. Examples: backfills for voluntary departures, second sales hire in an existing market.
- Nice-to-have (tier 3): Capacity roles that would help but have clear workaround options. Examples: marketing coordinator (can outsource), junior analyst (can use contractor).
Matrix-based prioritisation is critical because during the year, budget or market conditions often force trade-offs. A plan without tiers leads to arbitrary cuts driven by personal influence rather than business logic.
Timeline and Budget Planning
The timeline section turns priorities into week-by-week delivery targets. Most recruiting plans use a 12-month horizon broken into quarters, with the current quarter detailed week-by-week and future quarters in month-level granularity.
For each role, estimate the full hiring cycle:
| Stage | Typical Duration | Owner |
| Role scoping & JD sign-off | 1-2 weeks | Hiring manager + recruiter |
| Sourcing & applications | 2-4 weeks | Recruiter |
| Screening & first interview | 2-3 weeks | Recruiter + hiring manager |
| Technical/skills assessment | 1-2 weeks | Hiring manager + panel |
| Final interview & references | 1-2 weeks | Hiring manager + exec sponsor |
| Offer, negotiation, acceptance | 1-2 weeks | Recruiter + hiring manager |
| Notice period & onboarding prep | 2-12 weeks | HR + hiring manager |
Total elapsed time from role opening to new-hire start date is typically 8-16 weeks for individual contributors and 12-20 weeks for senior or leadership roles. Work backwards from the target start date to calculate when sourcing must begin. Roles with long notice periods (for example senior European roles where 3-month notice is standard) require particularly early sourcing.
Budget planning: For each role, calculate total first-year cost:
- Base salary (use local market benchmarks; see our country salary guides for verified 2026 rates)
- Employer burden (social charges, pension, health insurance, typically 15-55% depending on country – Brazil and France are among the highest, UK and Singapore among the lowest)
- Variable compensation (bonus, commission, equity)
- Benefits (health insurance, life insurance, wellness, mobile)
- Signing bonus and relocation (if applicable)
- Recruiting cost (agency fees typically 20-30% of first-year salary, ATS licence, assessment tools, sourcing platforms)
- Onboarding cost (equipment, training, lost productivity in first 90 days)
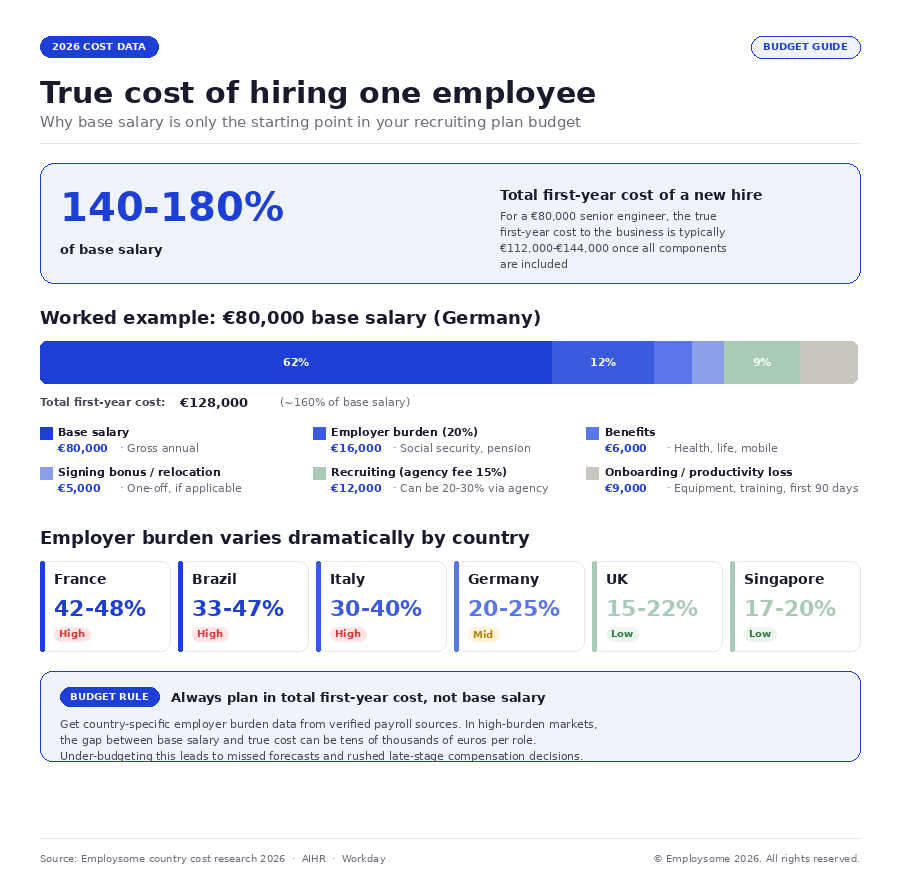
A common planning mistake is budgeting only base salary. Total first-year cost is typically 140-180% of base salary once all components are included. For a €100,000 senior engineer in Germany, the true first-year cost to the business is closer to €160,000-€175,000 when employer charges, equipment, recruiting fees, and onboarding productivity losses are counted.
💡 Employsome Insight: Total First-Year Cost Is Not Base Salary
Total first-year cost ≠ base salary. International companies frequently under-budget by assuming that the salary number is the total commitment. In markets with heavy employer burden (Brazil at 33-47%, France at 42-48%, Italy at 30-40%), this gap can be tens of thousands of euros per role. Always build your budget section using total first-year cost, and use country-specific burden percentages sourced from verified payroll data.
Sourcing Strategy, Selection Process, and Technology Stack
Sourcing strategy defines where you will find candidates for each role type. Different roles require different channel mixes. A recruiting plan that says “post to LinkedIn and wait” rarely delivers for senior, specialist, or international roles.
Channels typically used, with rough cost-per-hire indicators:
| Channel | Best For | Typical Cost |
| Employee referrals | Any role where cultural fit and speed matter | Referral bonus (~€1,000-5,000) |
| Internal mobility | Growth roles where existing staff can step up | Development costs + backfill |
| Careers page + organic | Brand-aware companies with steady inbound | ATS + employer brand costs |
| LinkedIn Recruiter | Mid-senior roles, specialist profiles | Seat licence + InMail cost |
| Job boards (Indeed, specialist sites) | Volume roles, entry level | Pay-per-post or pay-per-applicant |
| Recruitment agencies (contingent) | Hard-to-fill or specialist roles | 20-30% of first-year salary |
| Executive search (retained) | C-suite, critical leadership roles | 30-33% of first-year salary, partly paid up front |
| University partnerships | Graduate hiring, internship pipeline | Event and sponsorship costs |
| Community sourcing | Engineering, design, specialist roles | Sourcer time + community event costs |
Selection process: For each role type, define the evaluation stages, who participates, and what “good” looks like. Drawing on the Workday hiring strategy framework, best-practice selection processes in 2026 include structured scorecards (each interviewer rates agreed competencies on a defined scale), blind initial screening to reduce unconscious bias, and a named executive sponsor for senior hires to maintain decision quality and speed.
Technology stack: Document which tools are used at each stage. A typical 2026 recruiting stack includes an ATS (applicant tracking system) like Greenhouse, Ashby, or Workable as the single source of truth; a sourcing tool like LinkedIn Recruiter or HireEZ; an assessment platform for technical roles (HackerRank, CodeSignal); a scheduling tool (Calendly, Goodtime); and reporting via the ATS or a separate BI tool. Avoid tool sprawl – each additional tool creates integration complexity and data silos.
Metrics, Reporting, and Continuous Improvement
A recruiting plan is only as strong as your ability to track delivery and iterate. The reporting section of the template should define which metrics are measured, how often, and by whom. Below are the metrics every recruiting plan should include.
| Metric | What It Measures | 2026 Benchmark |
| Time-to-hire | Days from role open to offer acceptance | 30-45 days typical, 60+ for senior |
| Time-to-fill | Days from role open to new-hire start date | 60-90 days for most roles |
| Cost-per-hire | Total recruiting spend / hires made | $4,000-6,000 for individual contributors |
| Offer acceptance rate | % of offers accepted | 85%+ indicates good process; below 75% signals compensation or fit issues |
| Quality-of-hire | Hiring manager rating at 90 days and 1 year | Track trend; aim for 75%+ rated “meets or exceeds” |
| 90-day retention | % of new hires still employed after 90 days | 90%+ indicates good selection; below 85% needs review |
| Source of hire | Which channels delivered successful hires | Use to reallocate spend – referrals and internal mobility usually highest quality |
| Candidate experience (CSAT) | Post-interview survey rating | 4.0/5 or higher for process quality |
| Diversity funnel metrics | % underrepresented candidates at each stage | Track drop-off points to identify bias in process |
Monthly reporting is standard for active plans. Quarterly plan reviews should revisit the entire template – priorities shift, roles get added, market benchmarks change. An effective recruiting plan is a living document updated at least quarterly, not a static annual spreadsheet.
International Hires: Integrating an EOR into Your Plan
If your recruiting plan includes international hires, an Employer of Record (EOR) changes several of the template’s sections. The EOR becomes the legal employer in the target country, which affects budget, timeline, sourcing, and compliance sections of your plan.
For budget: Instead of establishing a local entity (which can cost €20,000-100,000 in setup fees plus 6-12 months), the EOR typically charges a monthly service fee of USD 299-699 per employee. This collapses the country-specific budget line significantly for small headcount. For larger teams (10+ in a single country), entity setup may become more cost-effective over a 2-3 year horizon.
For timeline: EOR-based hiring can typically onboard a new employee in 2-4 weeks after offer acceptance, versus 4-8 months for entity setup + hiring. This has major implications for how you sequence international hires in the plan.
For sourcing: EOR providers do not source candidates. You still need to run sourcing locally, either through in-house recruiters, local agencies, or international recruiting platforms. Some EORs partner with search firms but these are separate services.
For compliance and risk: The EOR assumes employer-of-record responsibility for local labour law compliance, payroll, tax withholding, and statutory benefits. This reduces the risk burden of international hiring significantly, particularly in high-complexity markets.
Consider EOR in your recruiting plan when:
- Entering a new country with fewer than 5-10 planned hires
- Testing a market before committing to entity setup
- Running parental leave cover, redundancy redeployment, or other short-to-medium-term needs
- Making senior executive hires where speed-to-start matters more than minor cost savings
- Managing legacy employees in markets where you no longer have an entity
Common Recruiting Plan Mistakes and How to Avoid Them
Even with a solid template, recruiting plans often fail in predictable ways. Knowing the common failure modes helps you avoid them.
| Mistake | How to Avoid |
| Planning only in headcount, not skills | List the capabilities each role must bring, not just the job title. This clarifies when internal mobility or upskilling is a viable alternative. |
| Budgeting base salary only | Always calculate total first-year cost including employer burden (varies by country), benefits, signing bonus, and recruiting fees. |
| Ignoring internal mobility | Flag every planned external hire as a potential internal move. Internal hires typically have 30-50% faster time-to-productivity. |
| Weak role prioritisation | Force every role into must/should/nice tiers up front. When budget cuts come mid-year, you already know what to defer. |
| No compensation framework | Set salary ranges and decision rights before sourcing starts. Late-stage compensation negotiations drag out cycles and lose candidates. |
| Annual plan with no quarterly refresh | Review the full template quarterly. Business priorities, attrition, and market conditions all shift within a 12-month cycle. |
| One-size-fits-all selection process | Use different selection depth for different role tiers. Over-engineering the process for junior roles kills candidate experience; under-engineering senior selection creates expensive mishires. |
| No metrics ownership | Assign a specific person to track time-to-hire, cost-per-hire, and offer acceptance weekly. Unowned metrics get ignored. |
| Sourcing channels without cost accounting | Track cost per source per hire. Most teams find 1-2 channels account for 60%+ of quality hires and should receive more spend. |
| Plan stored in a spreadsheet no one opens | The plan must live in a tool or dashboard your hiring managers and execs check weekly. A Google Sheet updated twice a year is not a plan. |
The single biggest mistake is treating the plan as a one-time exercise. Recruiting plans work like financial forecasts: you build the best version possible at the start of the year, then adjust monthly as reality diverges from the assumptions. A plan that has not been updated in six months is not helping anyone make hiring decisions.
Hiring internationally?
Your recruiting plan is only as good as your ability to deliver. If international hires are part of the roadmap, compare the top Employer of Record providers to onboard new team members in weeks rather than months – verified pricing, compliance scores, and independent rankings from Employsome’s research team.

Frequently Asked Questions
A recruiting plan template is a structured framework that helps HR and talent acquisition teams define which roles to fill, when, why, and how, over a set period (typically a quarter or year). It aligns headcount, budget, timeline, sourcing channels, selection process, and metrics into a single document. A well-built template turns reactive hiring into proactive workforce planning tied to business goals like revenue, product launches, and market expansion.
A comprehensive recruiting plan template includes ten core sections: (1) business context and goals, (2) workforce analysis, (3) role inventory, (4) prioritisation matrix, (5) timeline, (6) budget, (7) sourcing strategy, (8) selection process, (9) technology stack, and (10) metrics and reporting. The sections are sequential because each builds on the previous – business goals drive role inventory, which drives prioritisation, which drives timeline, and so on.
Most recruiting plans use a 12-month horizon, broken into quarters. The current quarter is detailed week-by-week, while future quarters stay at month-level granularity. Review the full plan quarterly – business priorities, attrition, and market conditions all shift within a 12-month cycle. A plan that has not been updated in six months is not actively helping hiring decisions.
In practice, the terms recruiting plan and hiring plan are used interchangeably. Both refer to a structured roadmap that outlines which roles need to be filled, when, why, and how. Some organisations reserve “hiring plan” for the headcount-focused view owned by finance or the business, while “recruiting plan” covers the operational detail owned by talent acquisition (sourcing, selection, technology, metrics). The underlying template and sections are the same.
Total first-year cost of a new hire is typically 140-180% of base salary once employer burden (social charges, pension, insurance), benefits, signing bonus, and recruiting fees are all counted. Country varies significantly: Brazil adds 33-47% employer burden, France 42-48%, Italy 30-40%, while the UK and Singapore are lower at 15-22%. Recruiting costs range from $4,000-6,000 for individual contributors (channels like LinkedIn and referrals) to 20-33% of first-year salary for agency or retained search placements. Always calculate total first-year cost in your recruiting plan budget, not just base salary.
The essential metrics are time-to-hire (days from role open to offer acceptance, typically 30-45 days), time-to-fill (role open to start date, 60-90 days), cost-per-hire ($4,000-6,000 typical for individual contributors), offer acceptance rate (85%+ is healthy), quality-of-hire (hiring manager rating at 90 days and 1 year), 90-day retention (90%+ indicates good selection), source of hire, candidate experience CSAT, and diversity funnel metrics. Assign a named owner to track these weekly – unowned metrics get ignored.
Yes, if international hiring is part of your business plan. International hires require additional planning for local labour law, employer burden (which varies from 15% to 55%+ depending on country), work visa timelines, and entity setup or Employer of Record (EOR) engagement. An EOR can onboard employees in a new country in 2-4 weeks versus 4-8 months for entity setup, making it especially useful for teams under 5-10 hires per country or market-testing scenarios.
The most common mistakes are: budgeting only base salary rather than total first-year cost (which is 140-180% of base); ignoring internal mobility and assuming every role requires external hiring; weak role prioritisation that produces arbitrary cuts when budget tightens; no compensation framework set before sourcing begins; one-size-fits-all selection processes regardless of role seniority; and treating the plan as a one-time annual exercise rather than a quarterly-reviewed living document. The single biggest mistake is a plan that has not been updated in months.
Written by
Christa is a Copywriter at Employsome with 17 years of professional writing experience across global brands, startups, and online publications. A native English-Finnish writer, she brings strong editorial skills and a versatile background in business, SaaS, and finance. At Employsome, Christa focuses on clear, practical content about HR, payroll, and Employer of Record topics.
Our content is created for informational purposes only and is not intended to provide any legal, tax, accounting, or financial advice. Please obtain separate advice from industry-specific professionals who may better understand your business’s needs. Read our Editorial Guidelines for further information on how our content is created.
Other posts
Review other blog posts